
Prompting Feedback Through Benchmarks
Overview
Prompting employees to fill out their work climate is done by starting a benchmark. A benchmark provides a snapshot of alignment between your people's expectations and their actual experiences at work.
Things to know about benchmarks:
- A benchmark runs for 7 days.
- During the benchmark, you can send reminders to people who have not yet responded.
- You can run a benchmark as frequently as once a month.
- You can compare work climate trends from one benchmark to another benchmark.
- Managers will be able to review their team's work climate under Workforce > Team Climate.
To access, click on: Threats > Work Climate > Benchmarks
Starting a Benchmark
Click on Start a Benchmark. This button is disabled if it has been less than 30 days since your last benchmark or you are currently running a benchmark.
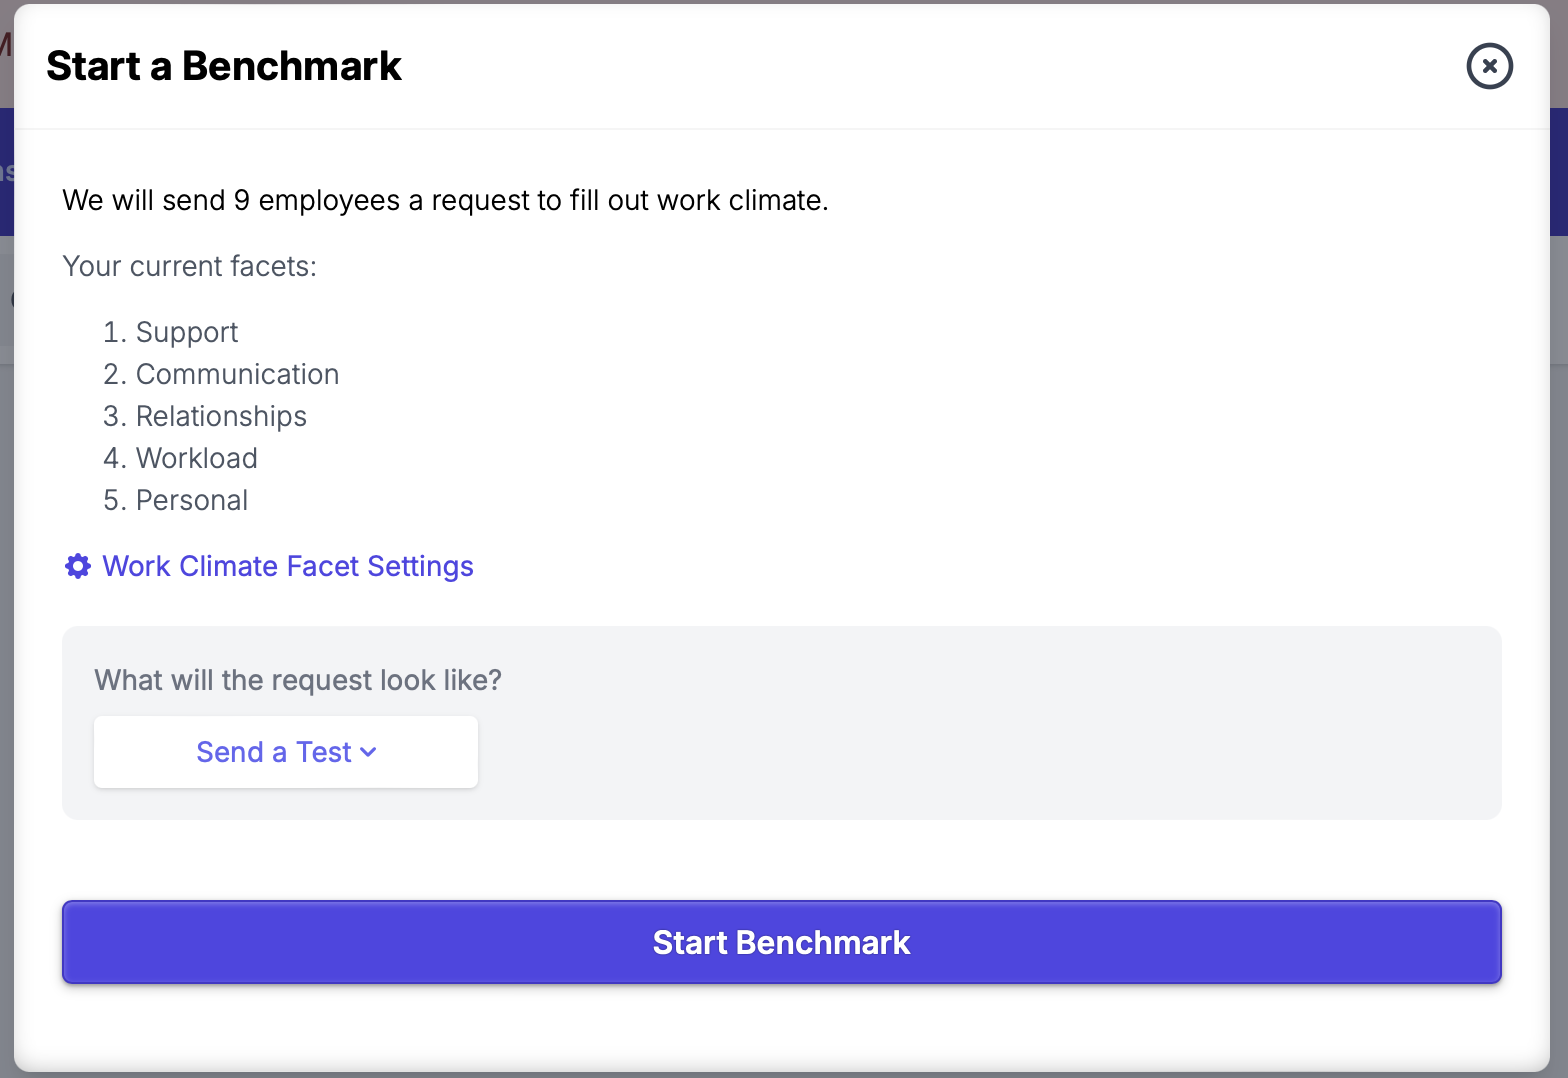
Here you will see your current facets and a link to adjust them, if needed.
Before beginning your benchmark, you can send a test to yourself or to a team member to understand how the benchmark functions.
When you are ready to start the benchmark, click on the "Start Benchmark" button.
Benchmark Progress
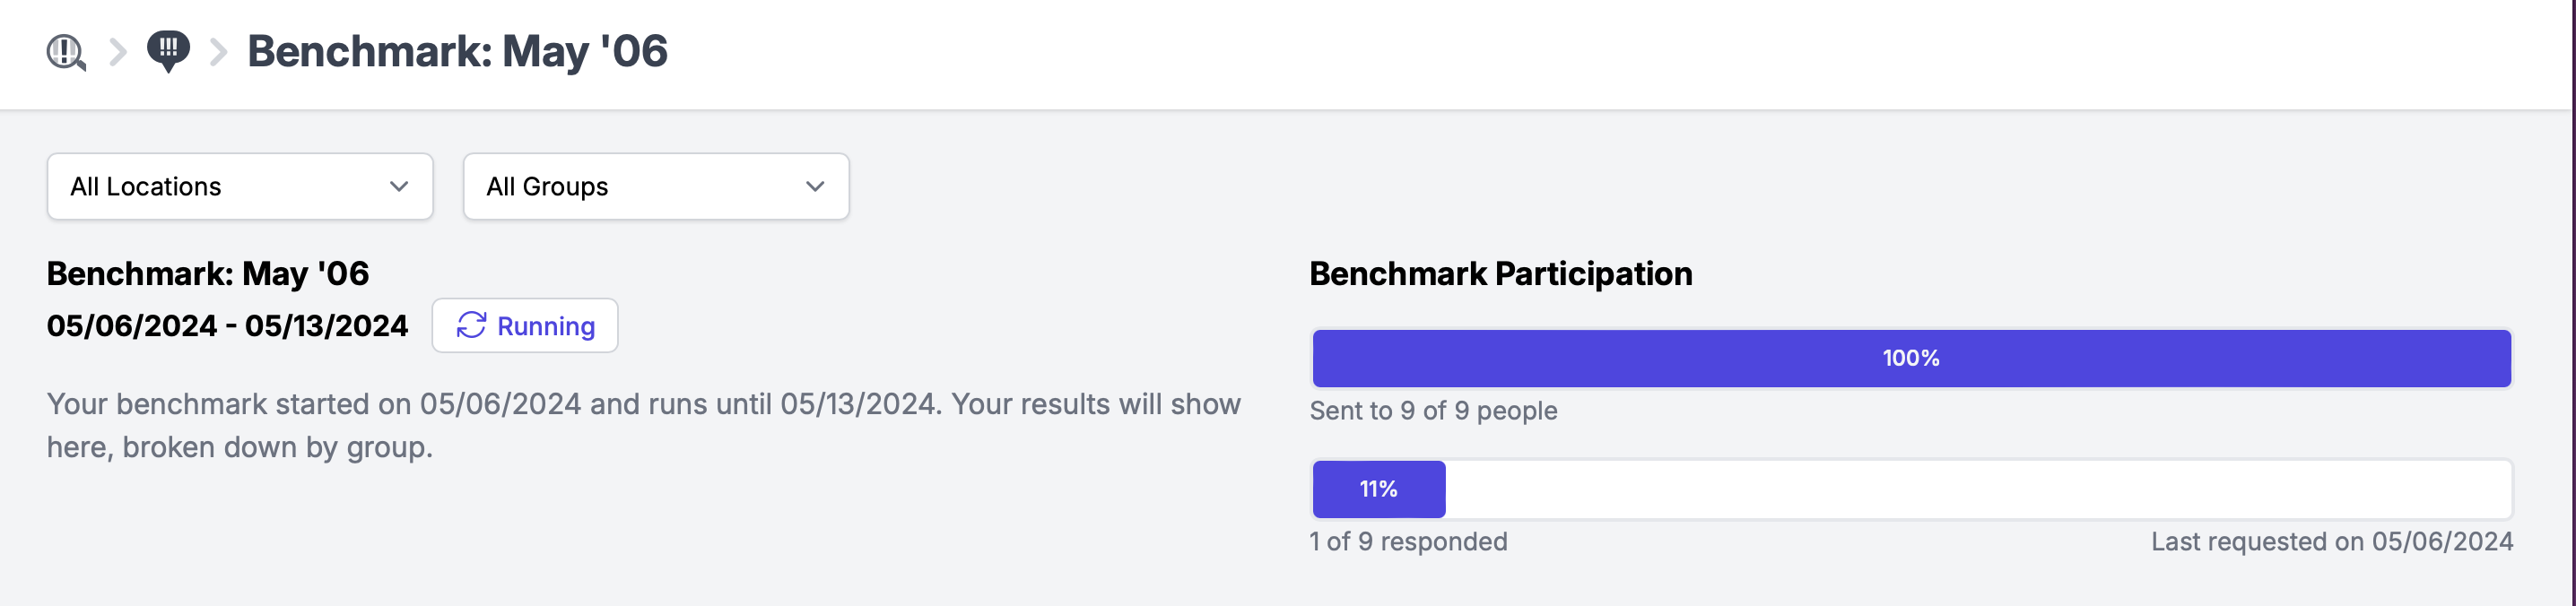
While the benchmark is running, you can view response rates and a chart of response scores for each facet.
You can filter on Location and Group to zero in on areas of interest.
Use the "Send Reminder" to remind anyone that has not yet responded with another notification. Be aware: there is no system limit to the number of times you can send reminders.
Benchmark Analysis
After 7 days or 100% participation is reached, whichever comes first, the benchmark will close and the benchmark's analysis will be available to review.

When viewing the results, you will see diagrams illustrating the work climate of each segment of employees.
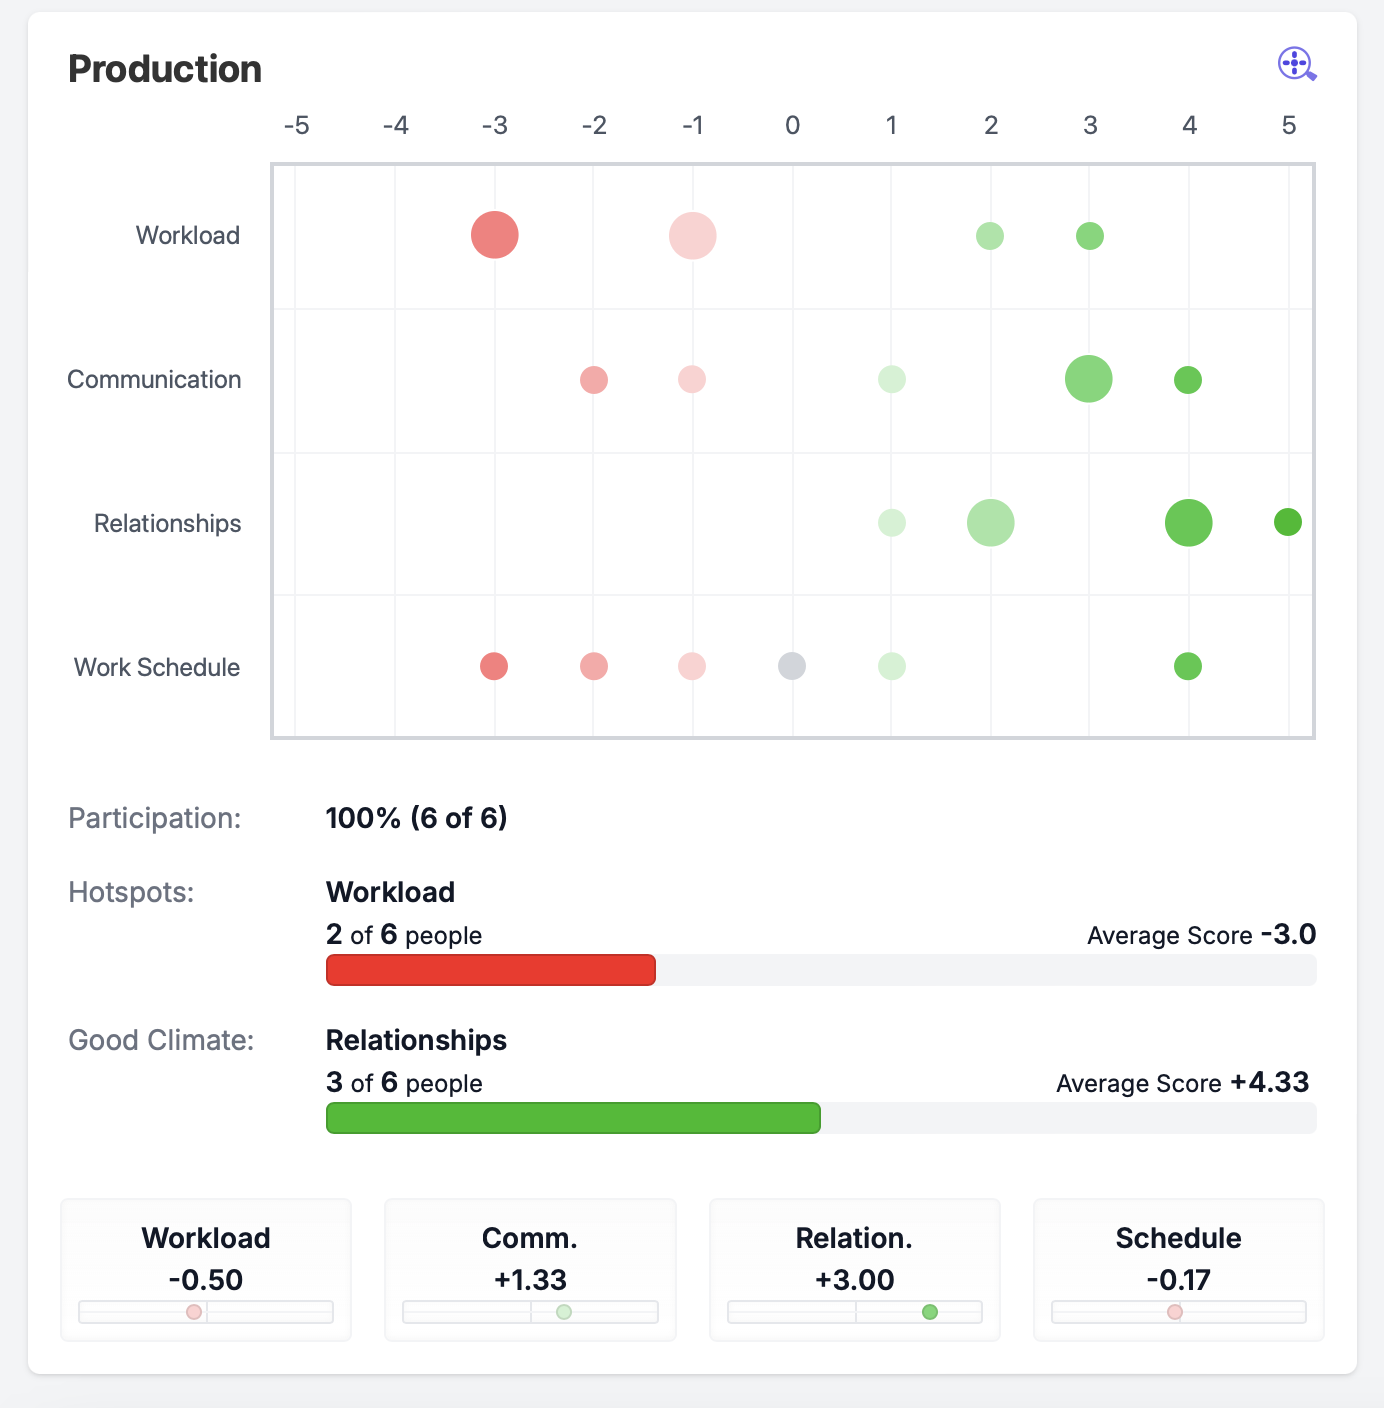
The diagram has values from -5 to 5, where 5 is the highest and -5 is the lowest employee satisfaction score. Zero indicates neutral status. The size of the circle indicates the number of users that submitted a particular score. The circle gets bigger when there are more people.
Red circles indicate a work climate problem that you should be aware of and take strategic action over.
This example demonstrates that every one of the six employees in the Production group has submitted their benchmarks, resulting in a participation rate of 100%. You'll notice several reddish circles on the chart but one in particular, Workload, qualifies as a hotspot. This is a facet that should draw immediate attention.
Facets that are doing well are listed under "Good Climate." In this instance, it is their relationships with their colleagues.
The Average Score is calculated based on the average score of submissions within a specific segment. In the given example, 2 out of 6 employees provided negative feedback on their workload, and the average score of -3.0 was calculated based on these two employees’ submissions.
What is a hotspot?
A hotspot is where more than X people within a segment feel very negative about something (a score of-3 through -5). X is a sliding scale but always greater than 1. For a small segment, you need at least 2 people to have a hotspot. For a large segment, you may need 10 or more.
Click on the magnifying glass within the selected group window to dig into the details of the work climate results. You will be taken to the Team Climate page, which is filtered to display the people who make up this segment.
