
Understanding Your Managers' Performance
The Managers Dashboard is a great tool for executives and leadership to monitor and understand the performance of managers in the context of their team's work climate.
To access, go to: Threats > Work Climate > Managers
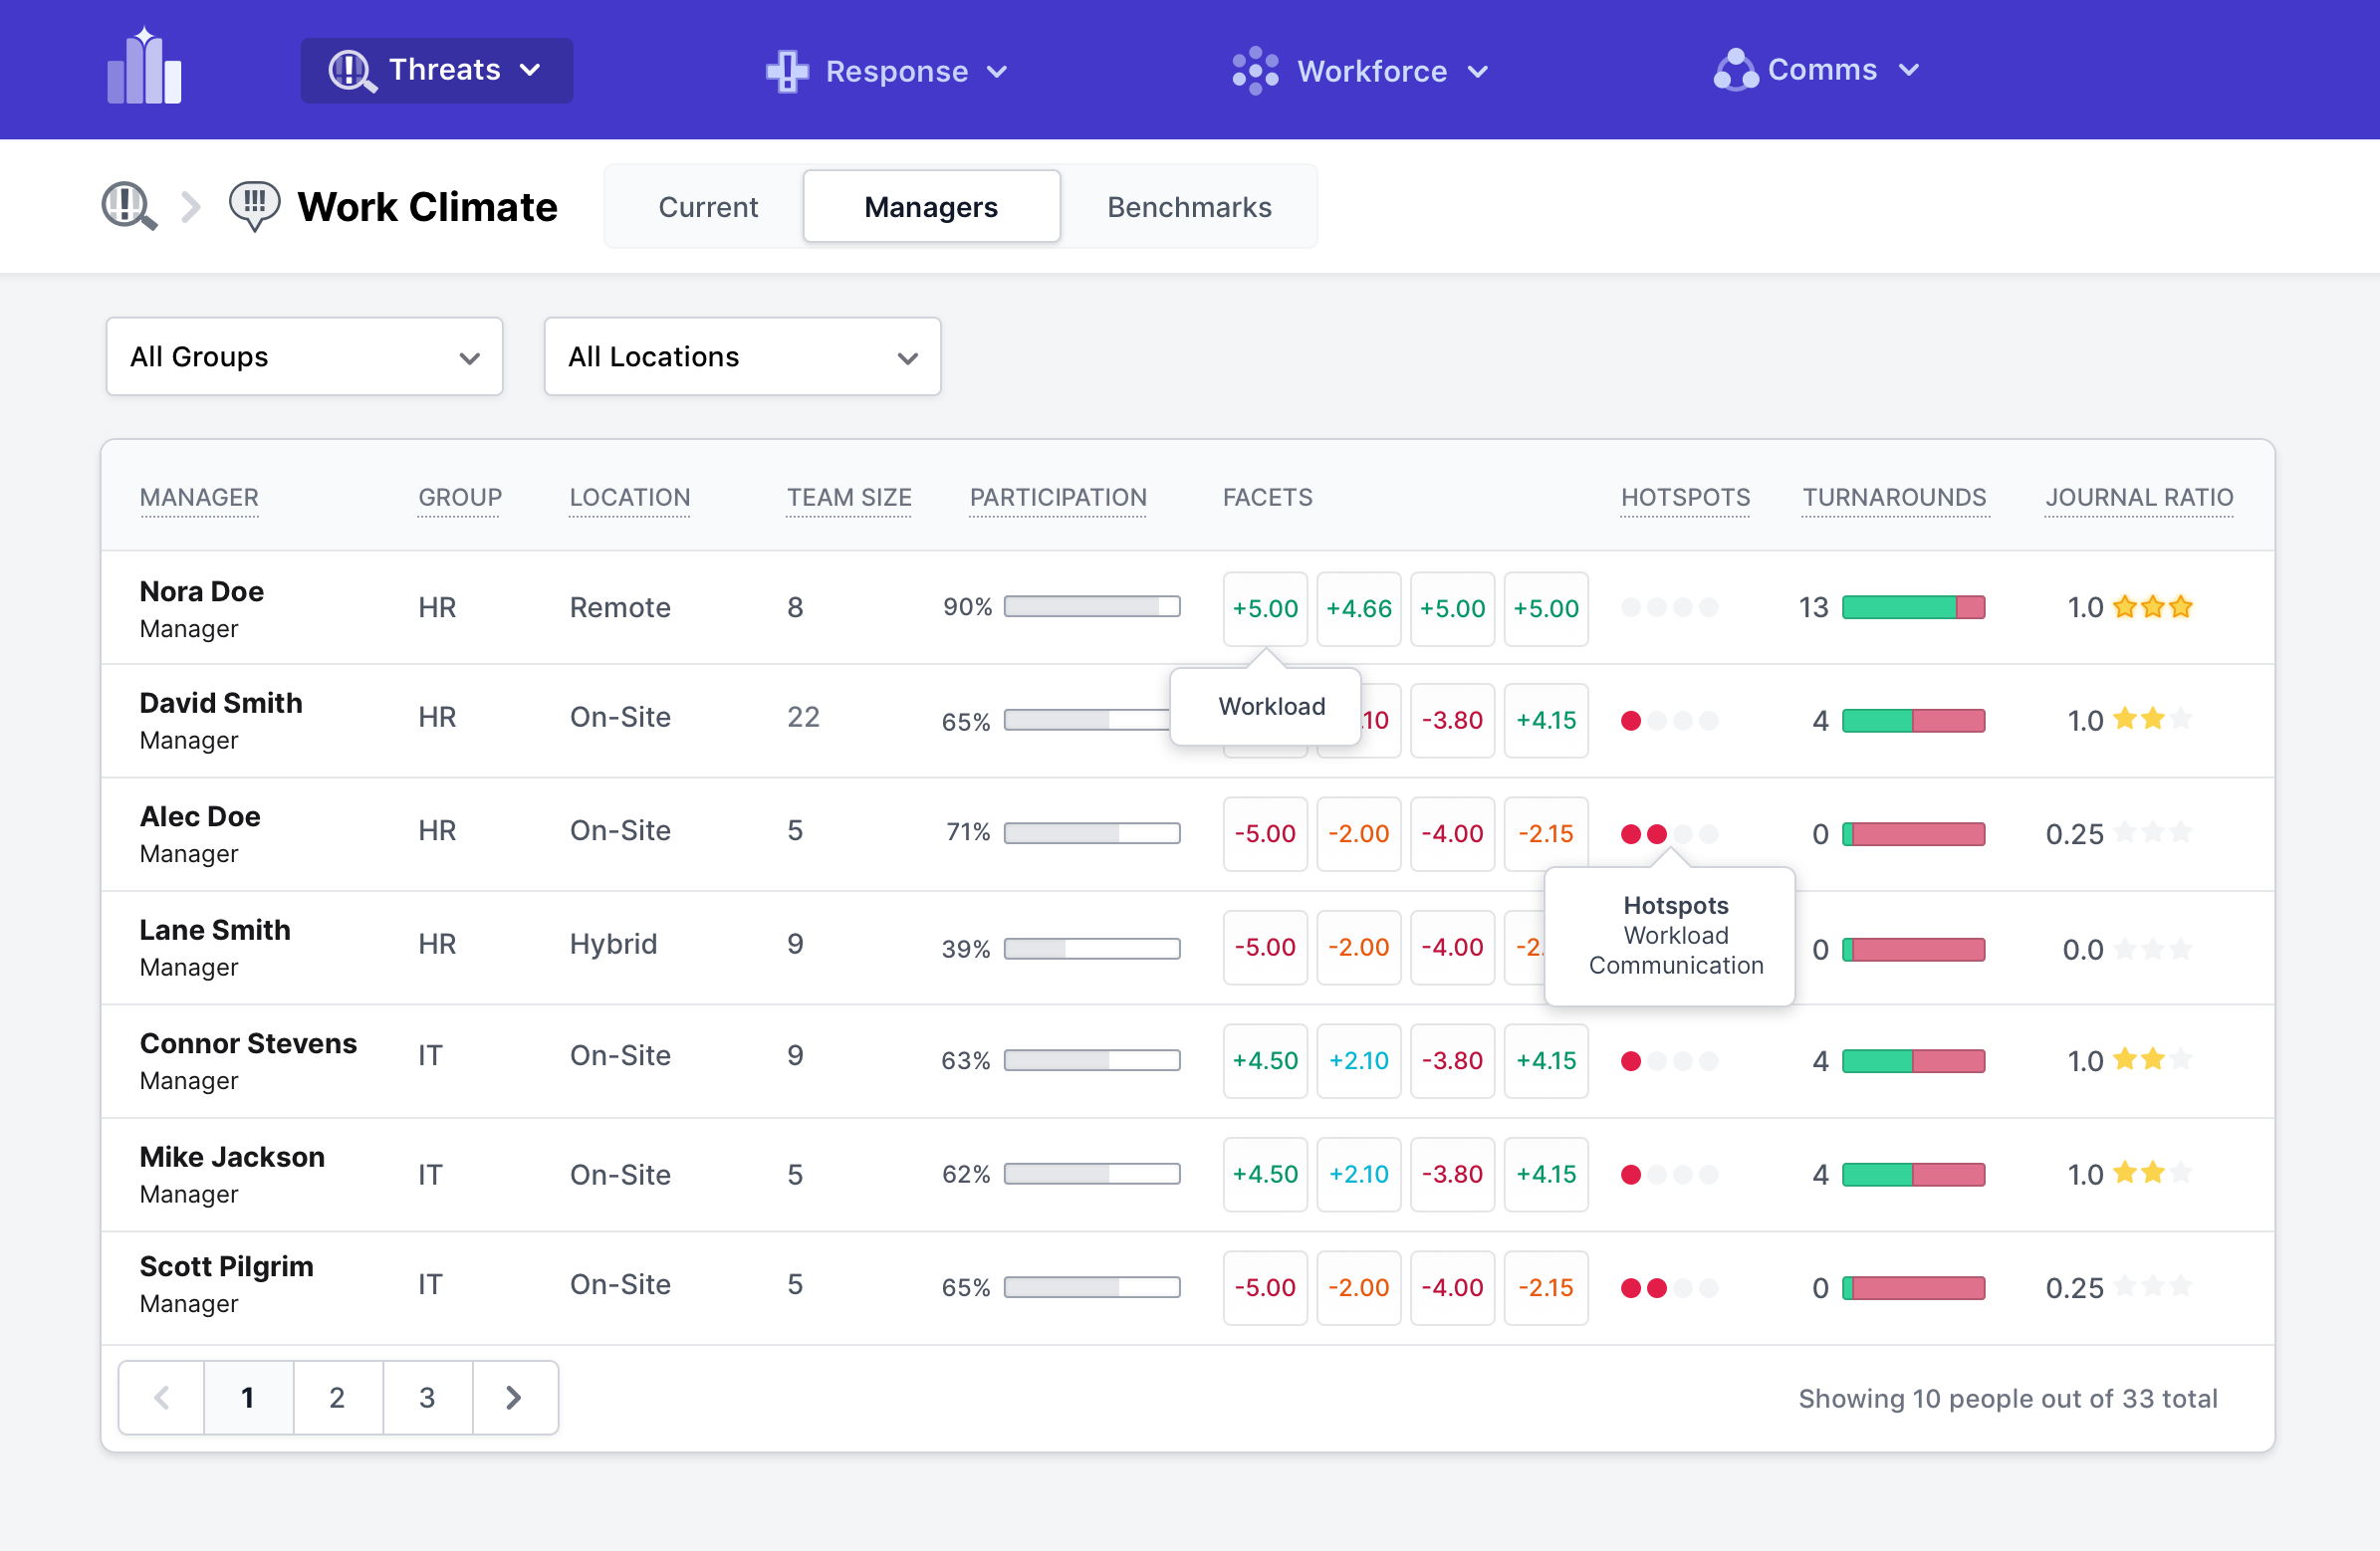
These metrics provide a high-level overview of how each manager is performing, making it easy to identify trends and areas of strength or concern. The dashboard facilitates the comparison of different managers' performance metrics. This feature is helpful for identifying high performers and pinpointing areas that may require additional support or improvement.
The performance indicators and statistics for each manager include:
- Team Size: The number of team members currently managed.
- Participation: The level of team member engagement and participation in submitting work climate.
- Facet Scores: Average scores across each facets. 5 is the highest and -5 is the lowest score.
- Hotspots: Facets that are rated very poorly by at least 2 individuals and need immediate attention.
- Turnarounds: Two data points:
- The number indicates the number of times a team member has gone from negative climate to positive climate (A turnaround in mood)
- The ratio of drops to turnarounds. The more green the better. I.e., for each drop to negative climate, there should be a corresponding turnaround. This is "fixing" the root problem.
- Journal Ratio: The ratio of employees' climate submissions to managers' journal entries. I.e., how much the manager is recording their interactions with a team member.
For more in-depth information, clicking on a manager's row in the list will navigate you to that manager's dashboard page. Here, you can access detailed performance data and insights specific to that manager.
By utilizing the Managers Dashboard, executives can make informed decisions to enhance management practices and drive organizational success.