
Making Use of the Dashboards
PrevailHQ offers multiple Dashboards to allow your organization statistical data overview within the system. It is your one-stop shop for getting an overview of what is going on at your organization. The dashboards are located under the Launchpad page ( Home Page) and Reports.

Here you can switch between Executive, Team Lead, Case, and Vaccination Dashboards.

Please Note: Different dashboards and features will be visible depending on the product purchased.
Other Dashboards that are located under the related tabs include Locality(Workforce Tab) and Availability (Threats Tab).
Executive Dashboard
This dashboard can be used as the main source for tracking your organization's workforce statistics in PrevailHQ. The Executive Dashboard allows you to review your organization's levels of workforce availability, absences, workplace compliance, work climate, vaccination coverage, active cases, and external factors.
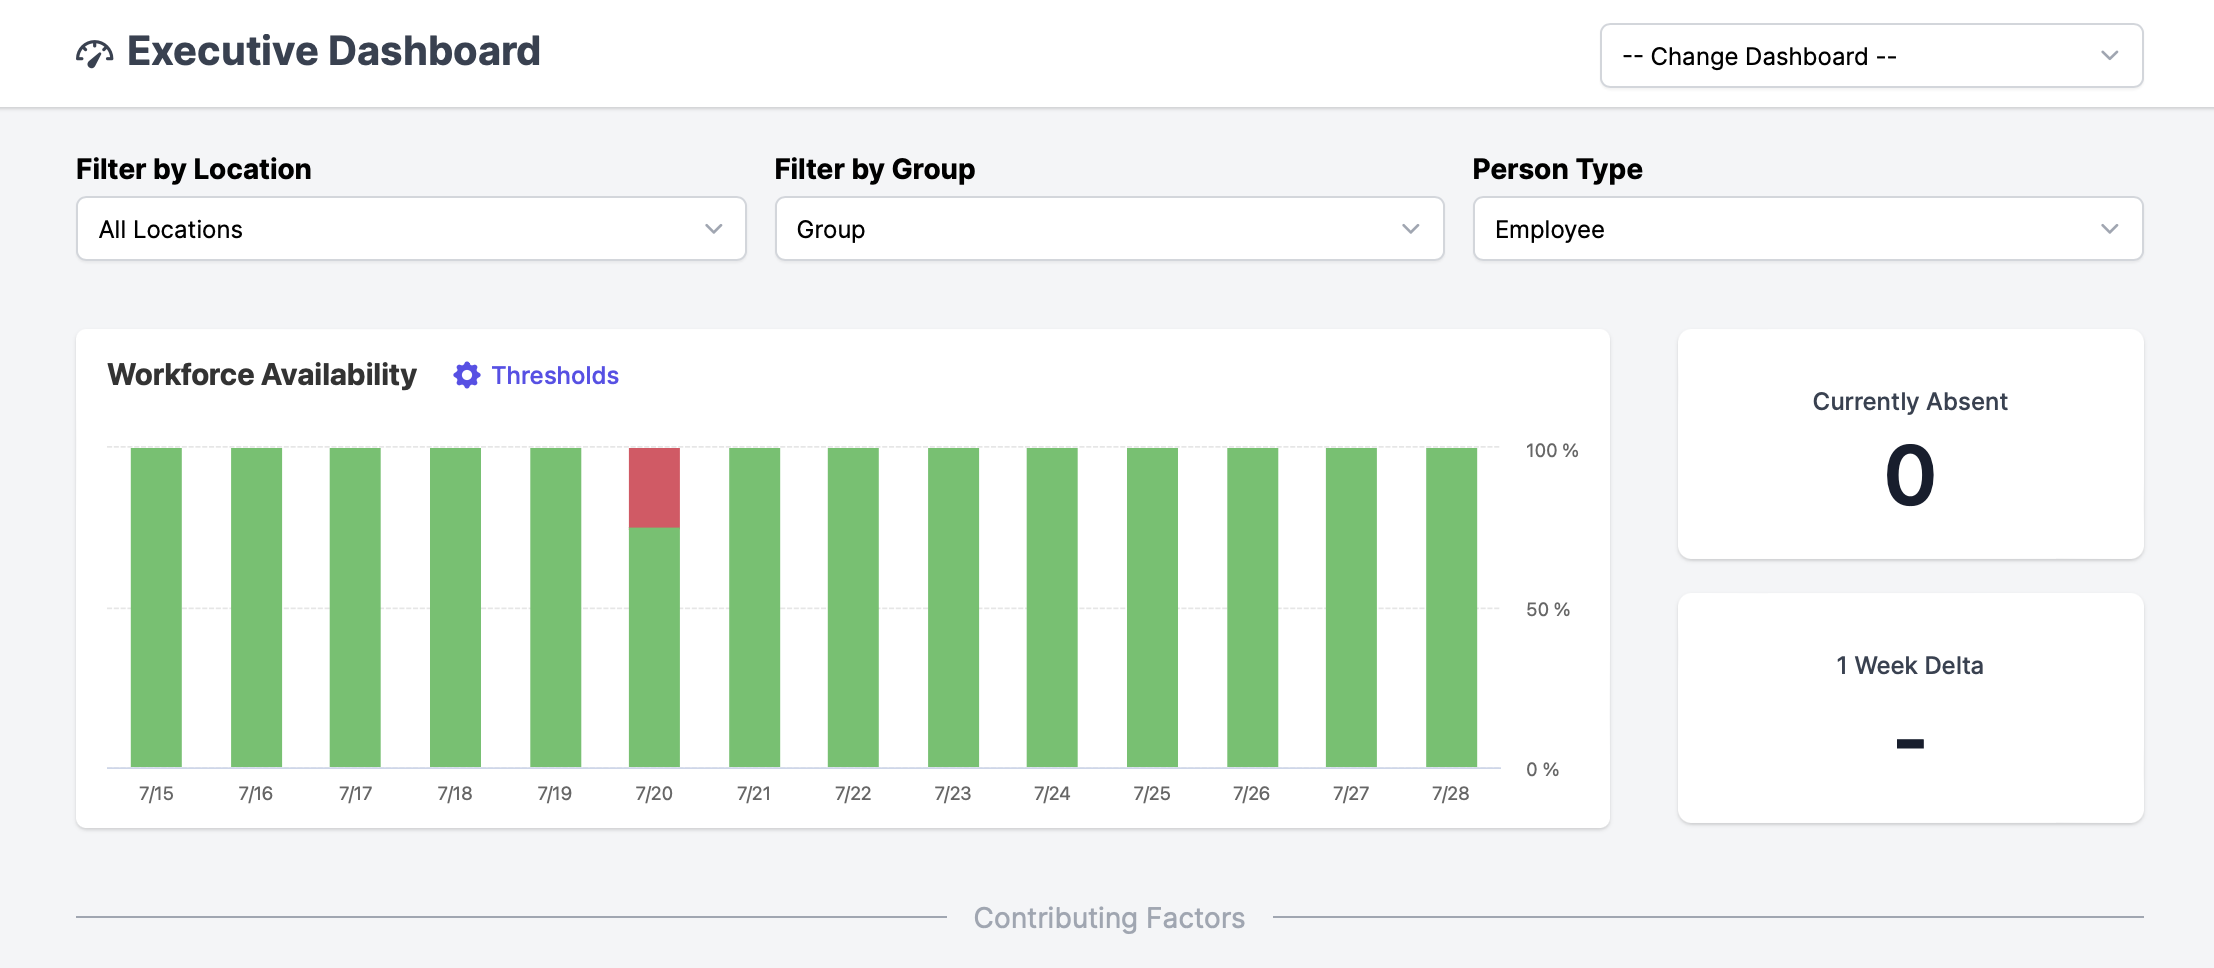
The first section of the Executive Dashboard is the main section, which shows your organization's overall Workforce Availability, including what Thresholds you'd like to be warned at, how many absent users you have, and your overview over one week.
By Clicking on "Thresholds" you can create up to two percentiles you'd like to be warned at, and they will appear as below.
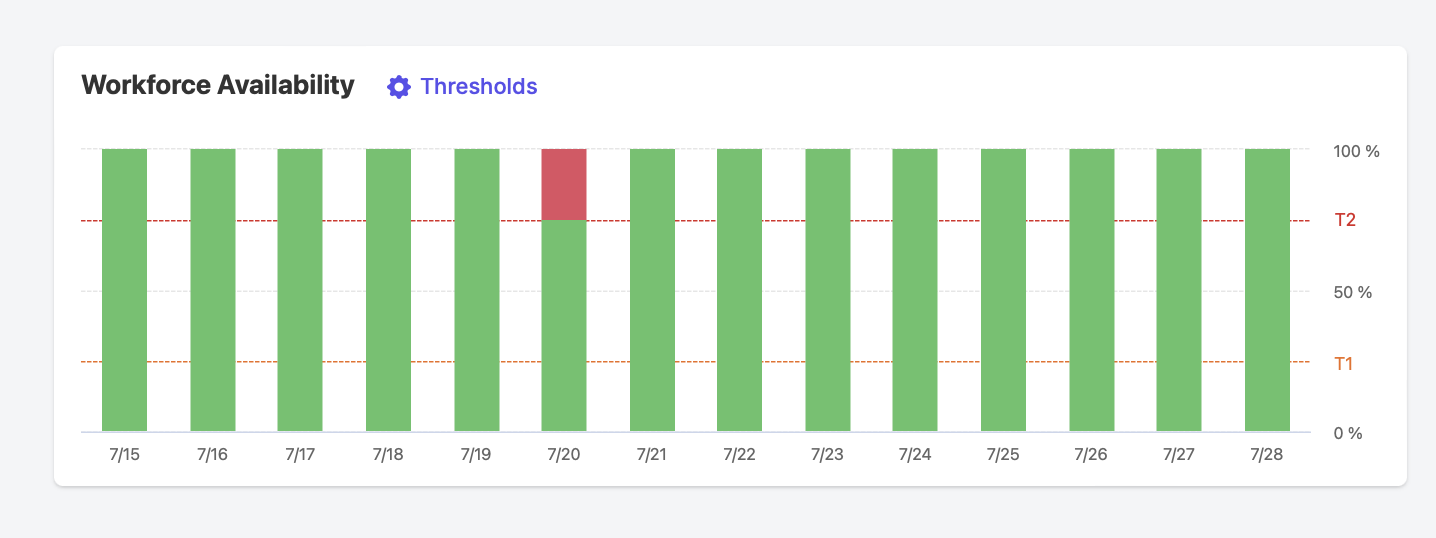
Screen_Shot_2022-07-28_at_2.07.44_PM.png
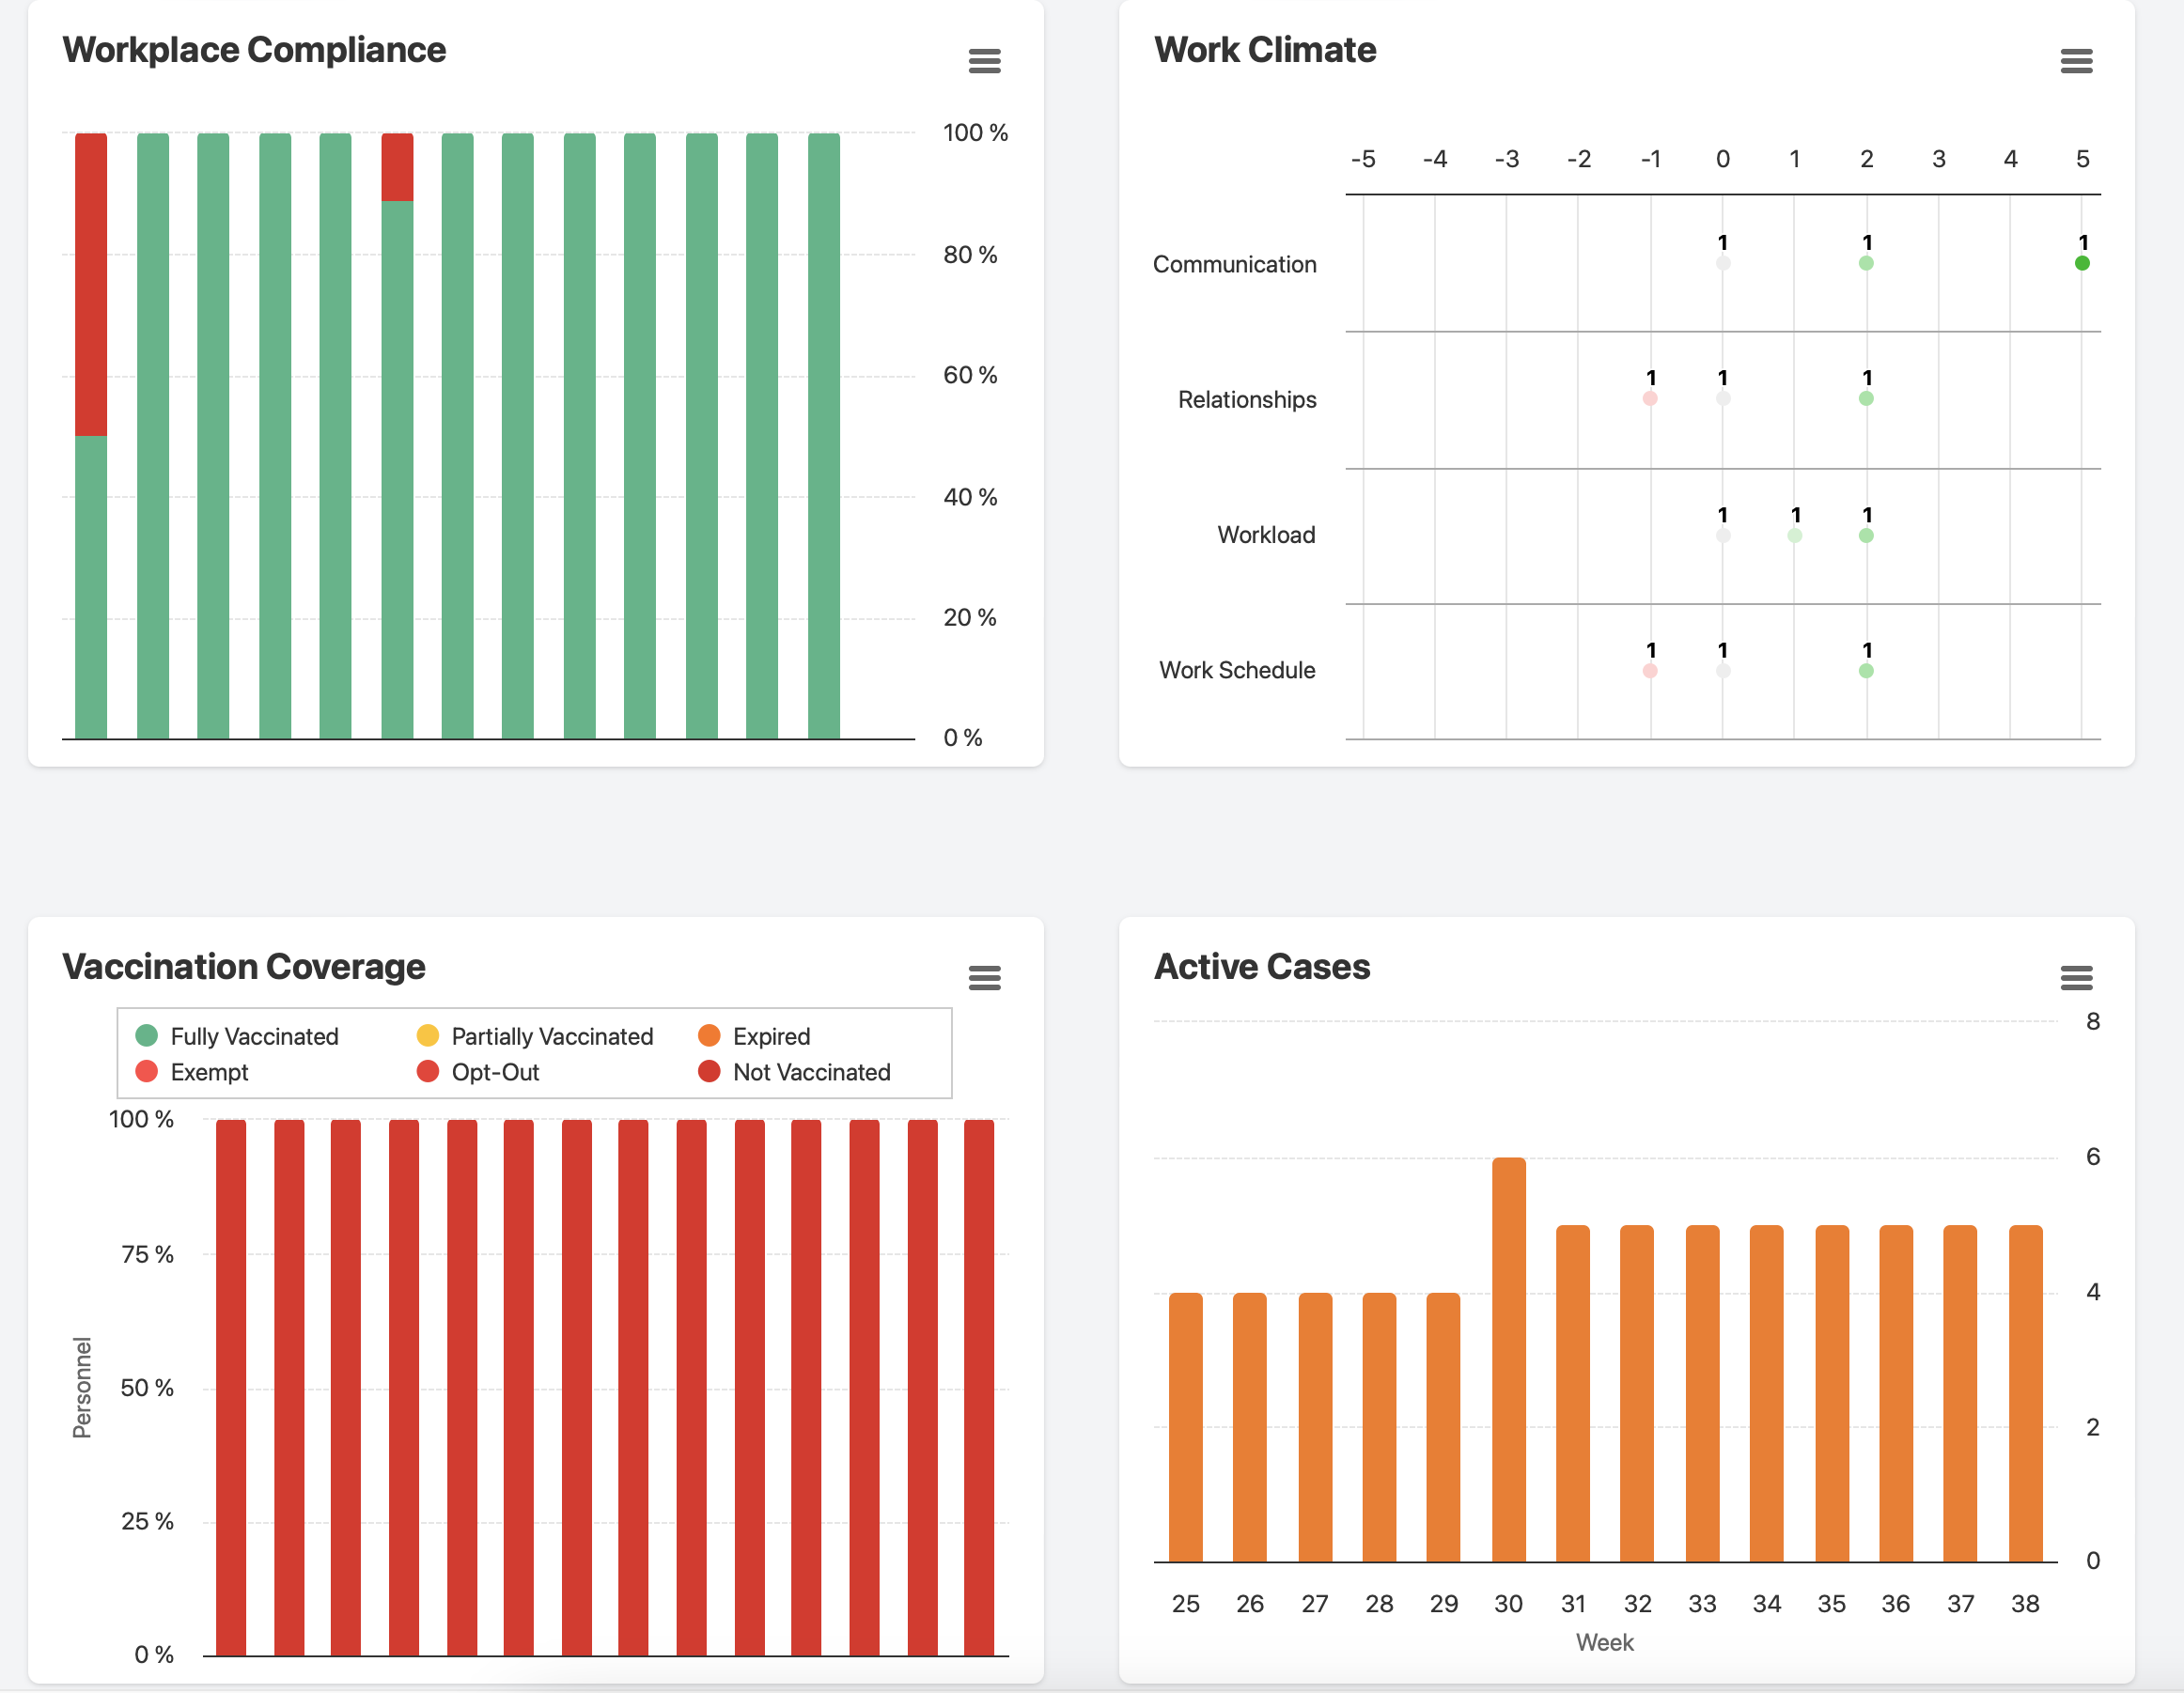
Also on this dashboard, you can view an overview of the contributing factors to your workforce's compliance, work climate, vaccination coverage, and cases.
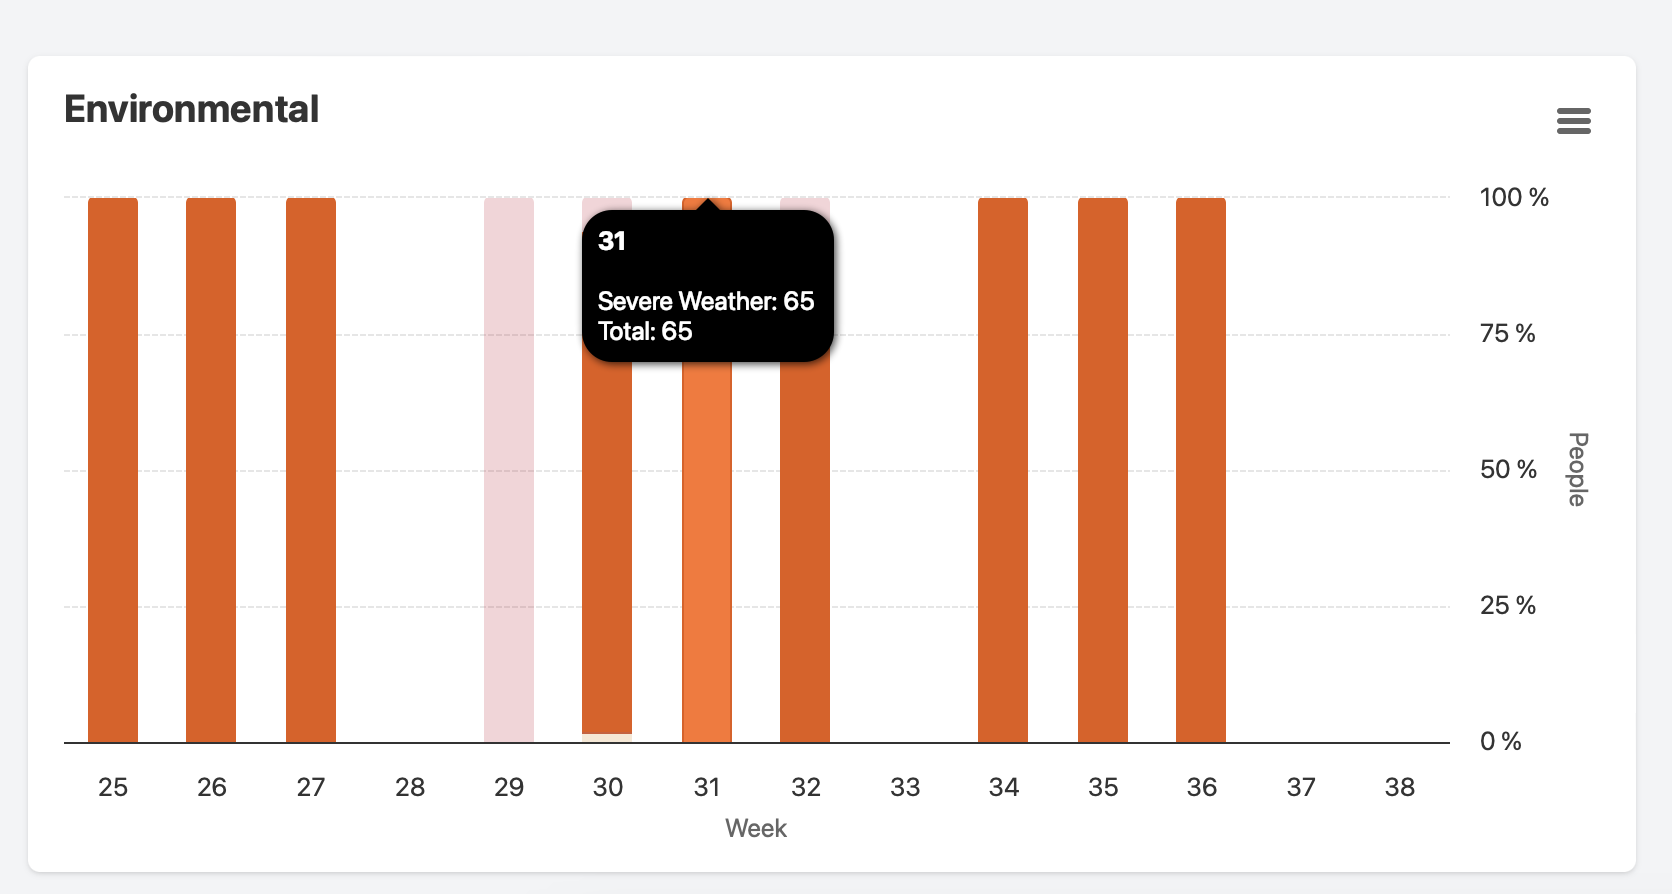
At the end of the dashboard, there is the External Factors section, where you'll see the Environmental graph, which reports the percentage of people who may be negatively affected by severe weather, health warnings, or other external disruptions. You can also view the Radar page for a more specific look at your area.
Team Lead Dashboard
The Team Lead Dashboard will allow you to see the compliance status of your users day by day. If needed, you can only see compliance status' by Group, Location, or Shift.
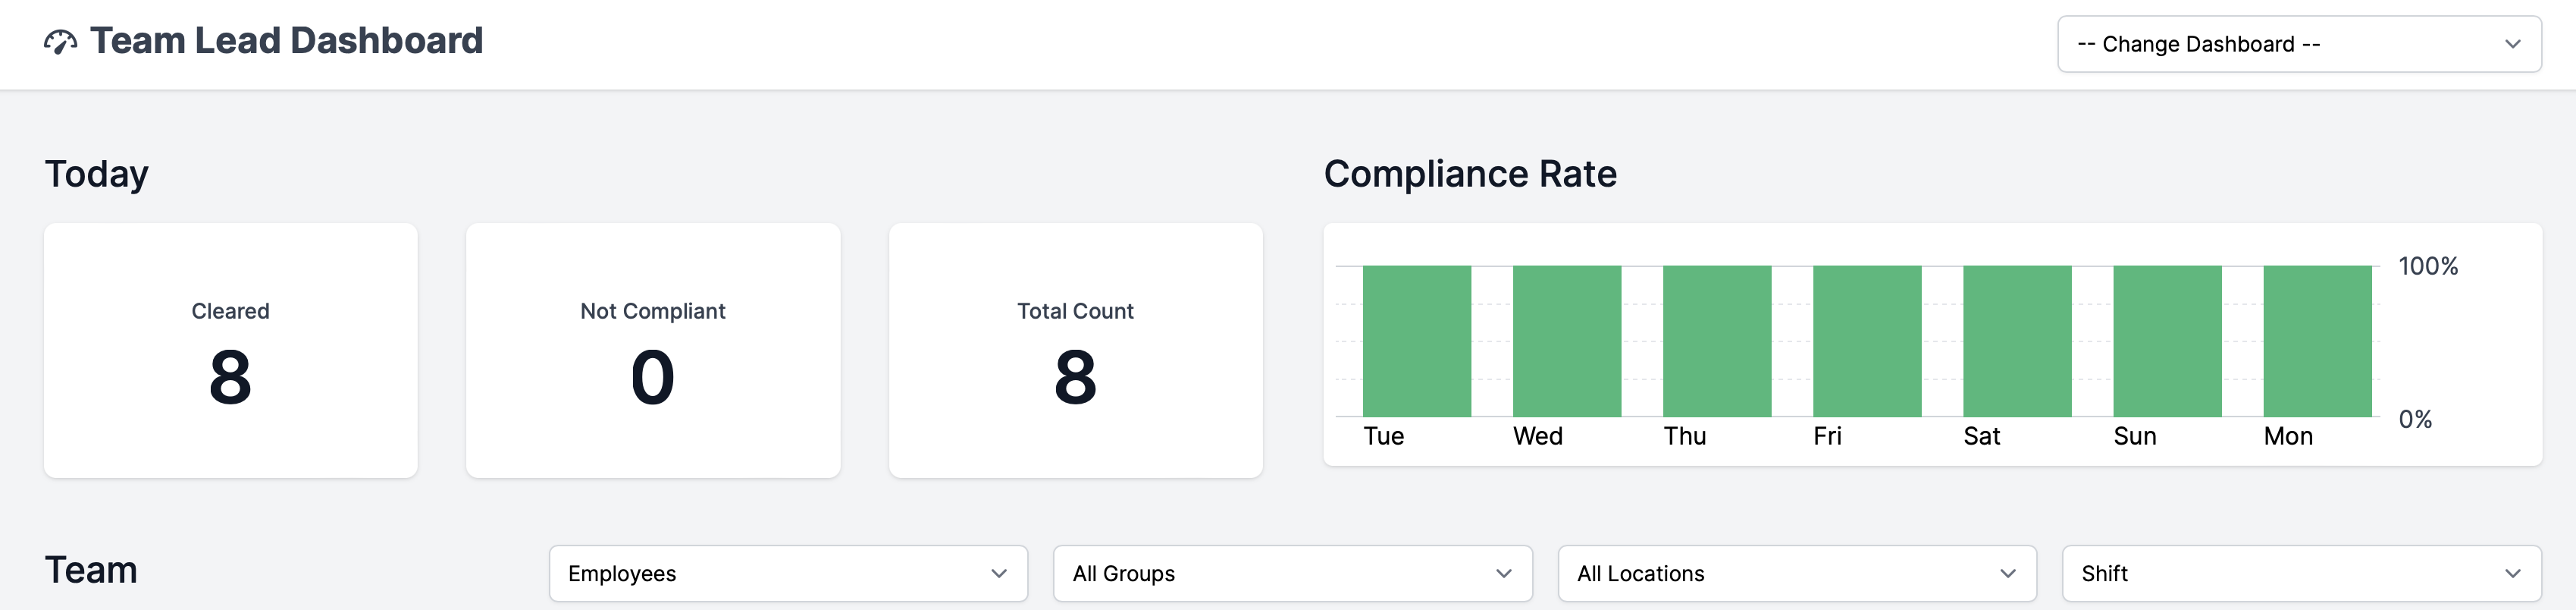
This listing shows the Employee's Location, what device they are using the screen, and the time the screening was completed. However this does not show the results of the screening, but simply that the screening was completed indicated by a green "Screened" icon. To see the results of the screening, navigate to the Roll Callpage.

Case Dashboard
Case Dashboard overviews your organization's case and participation statistics for the past 30 days.
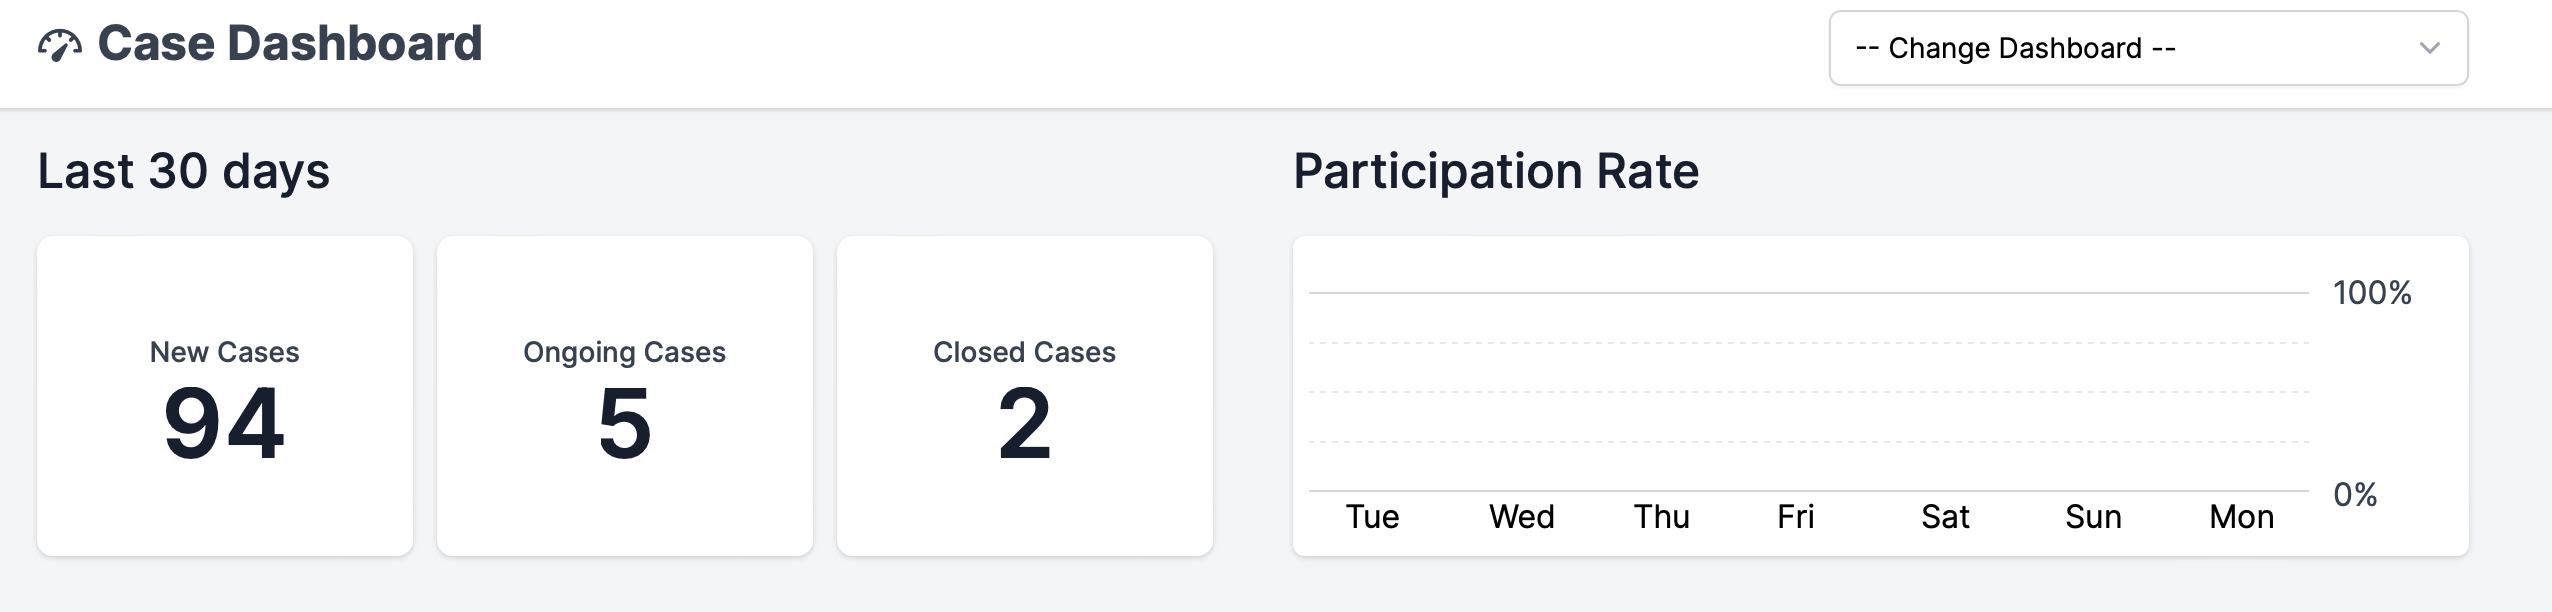
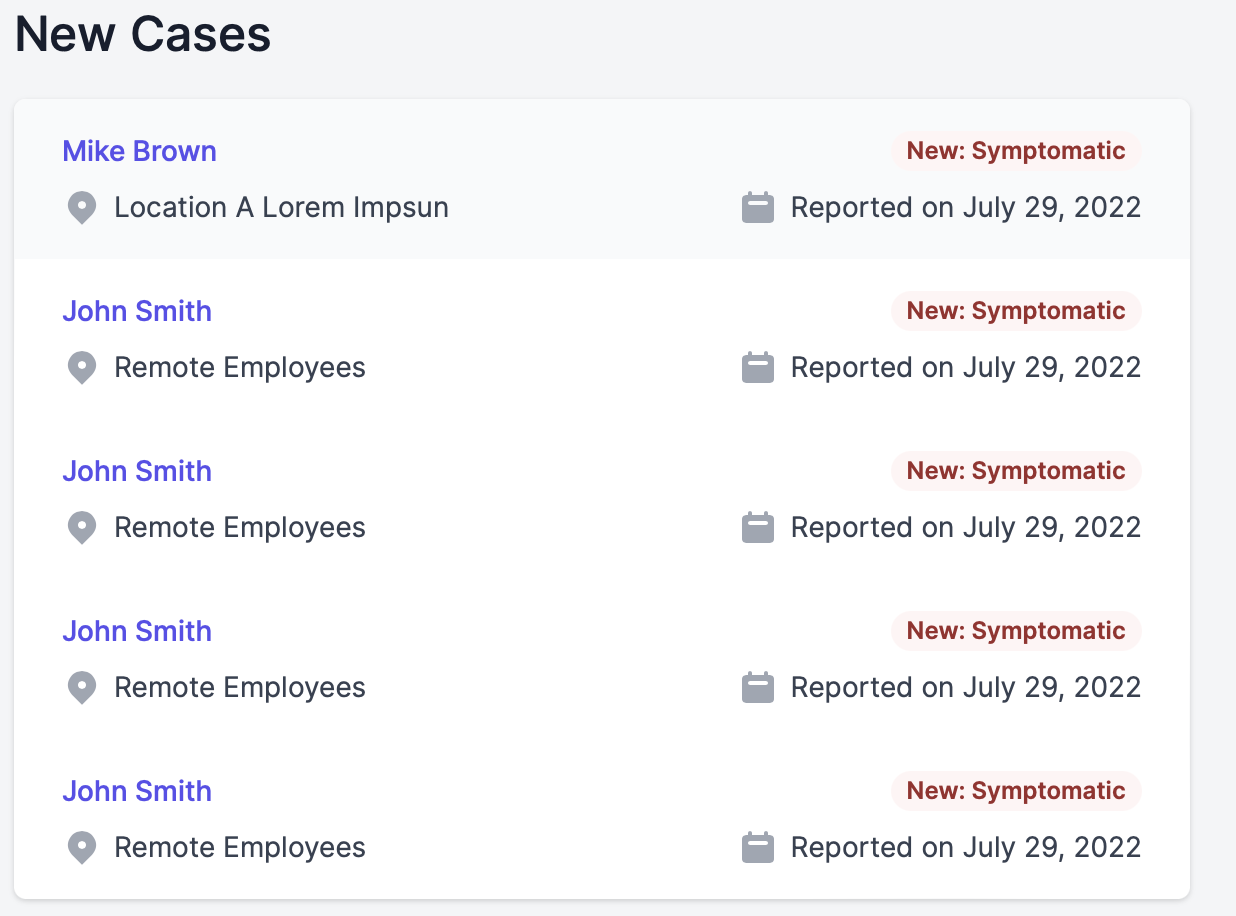
You can view cases for the past 30 days using this dashboard. Click "Go To Case Management" at the bottom of the page to be transferred to the Case Management tab and view all the cases.
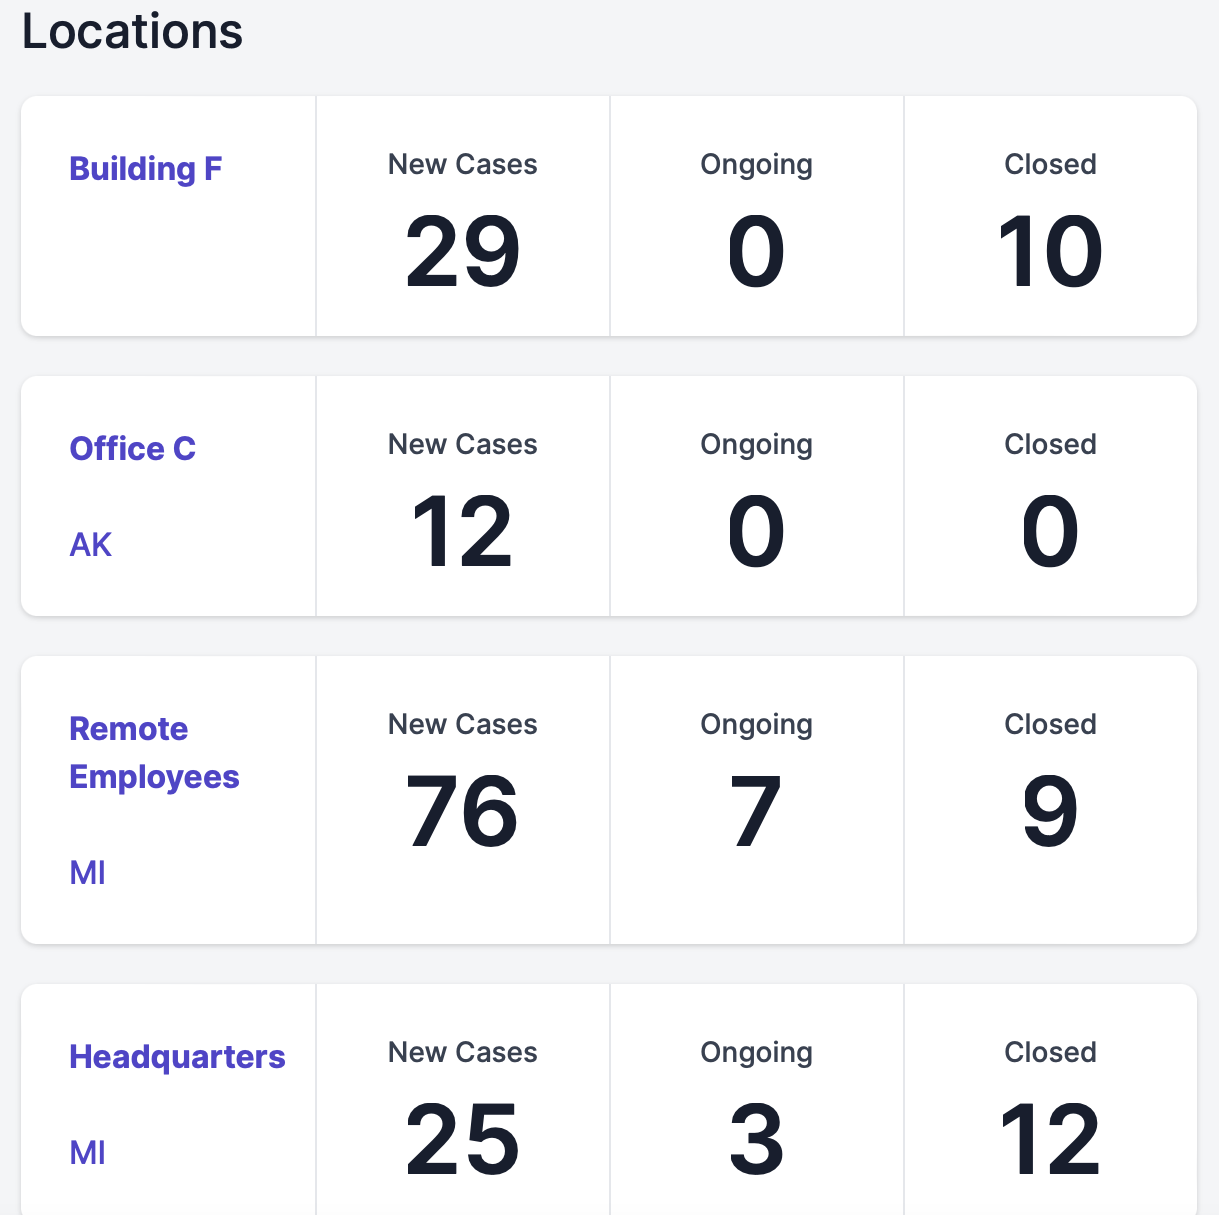
View case statistics by location.
Vaccinations Dashboards
The Vaccinations page shows submission and status data for vaccination submissions, as well as the unknown response rate.
At the top of the page, you'll see the vaccination status of your users, the average wait time for vaccinations, how many are waiting for a response, and submission response times.
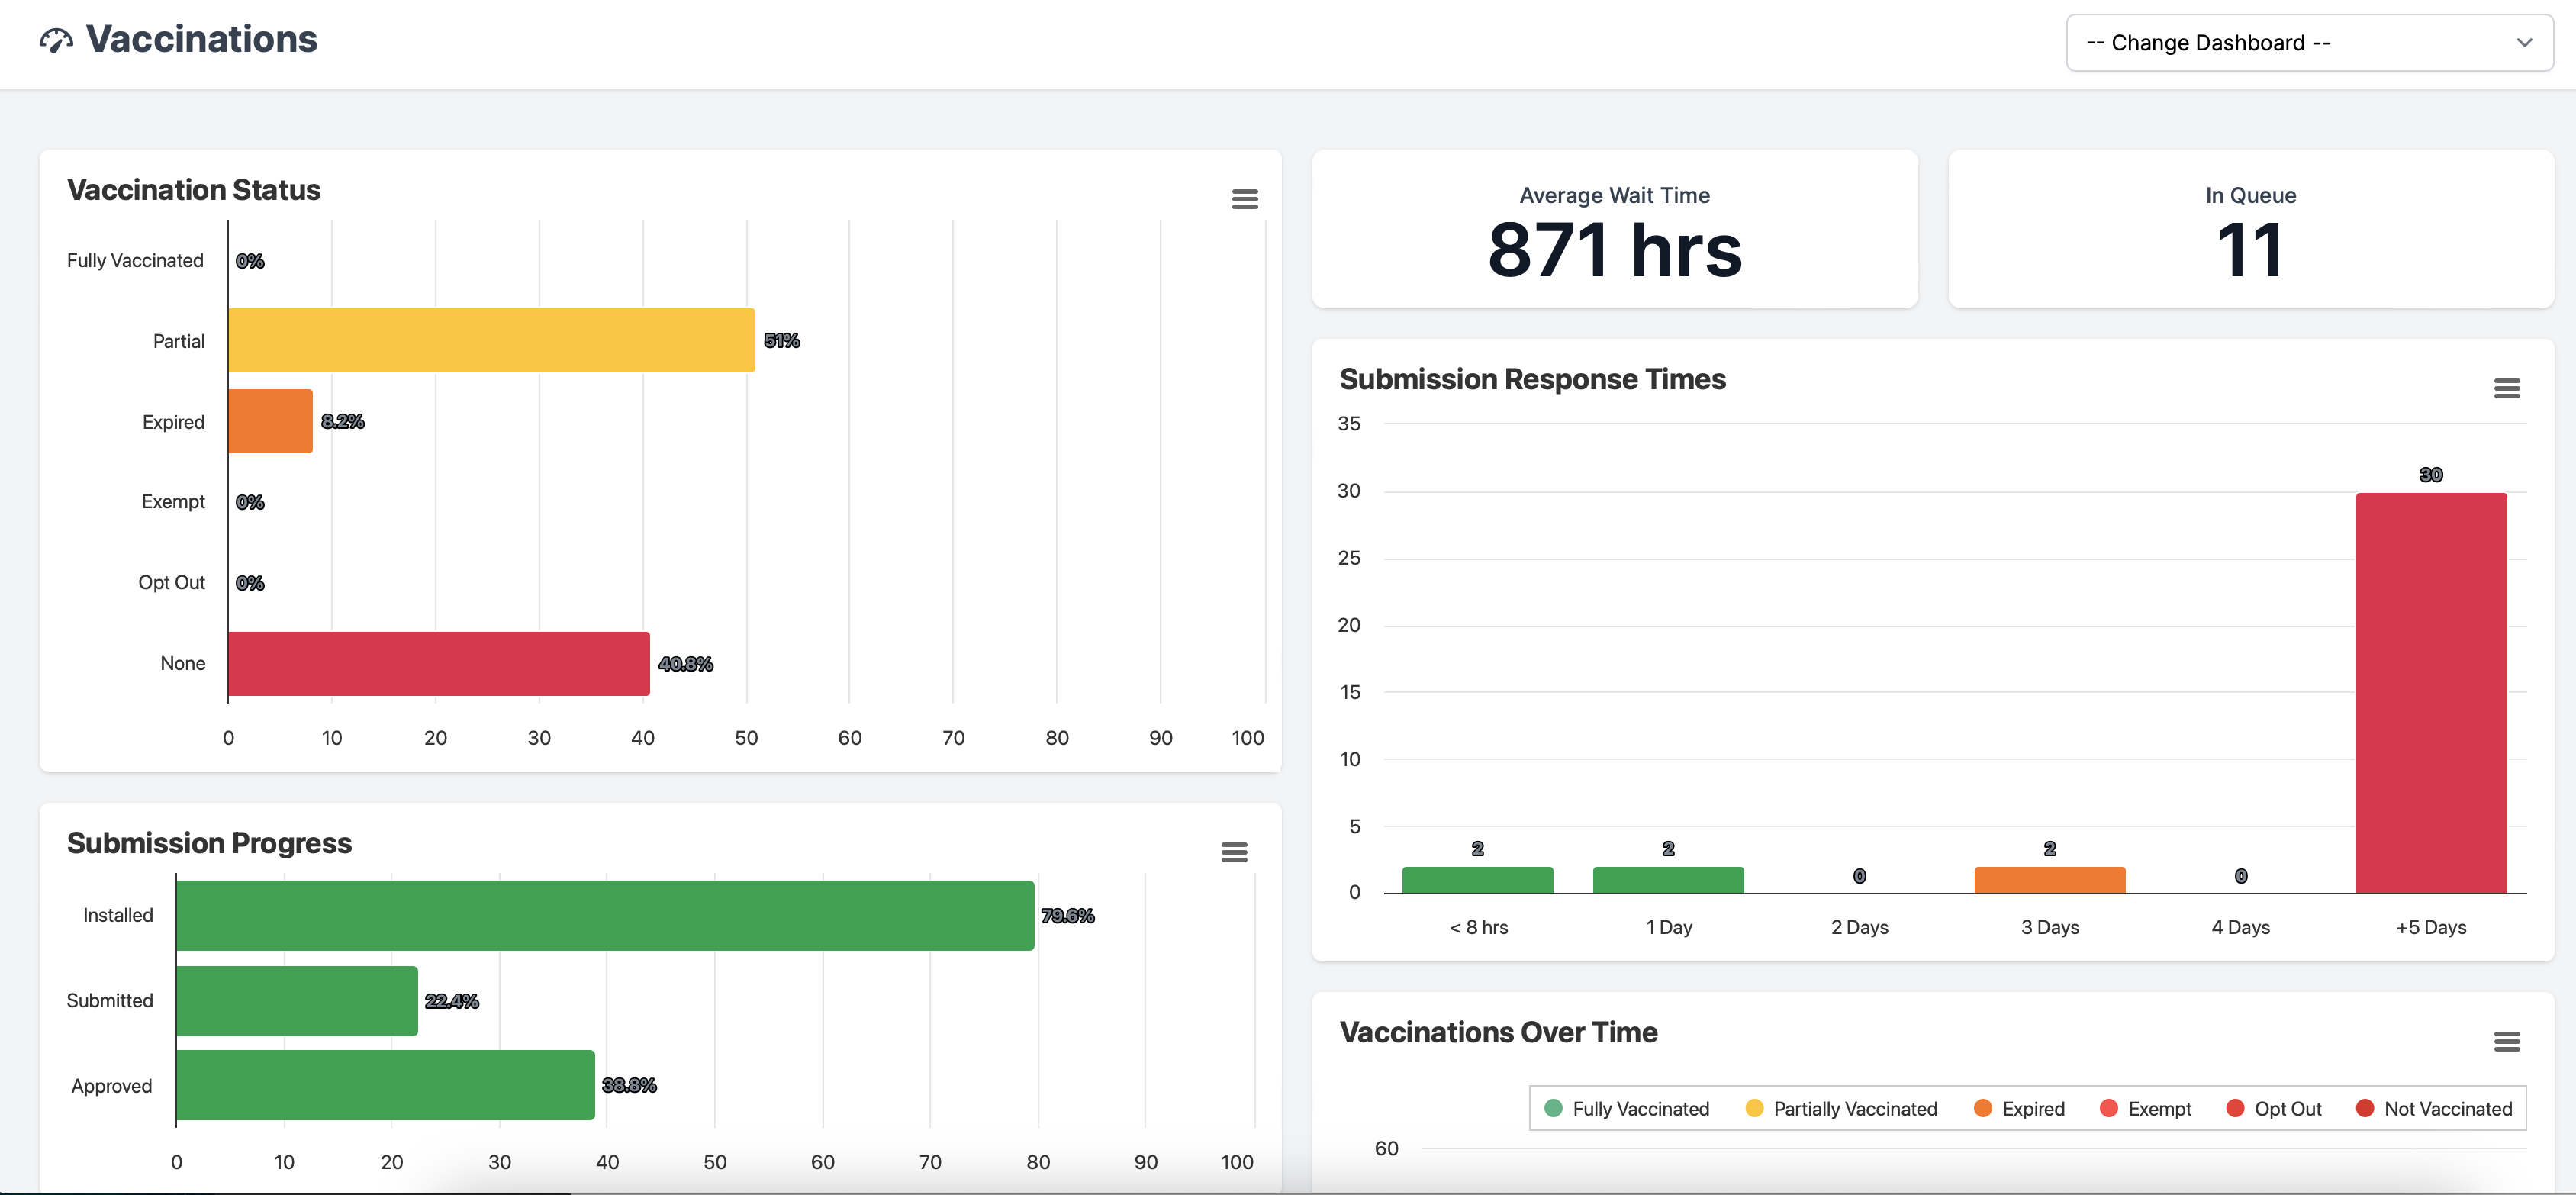
The second half of the page shows your submission progress, which includes who has the mobile app installed, how many have submitted their information, and the approval of those users. You'll also see the percentage of users who have an unknown response - whether that be no app installed, not submitted at all, or rejected - as well as an overview of your vaccinations over time, throughout your organization.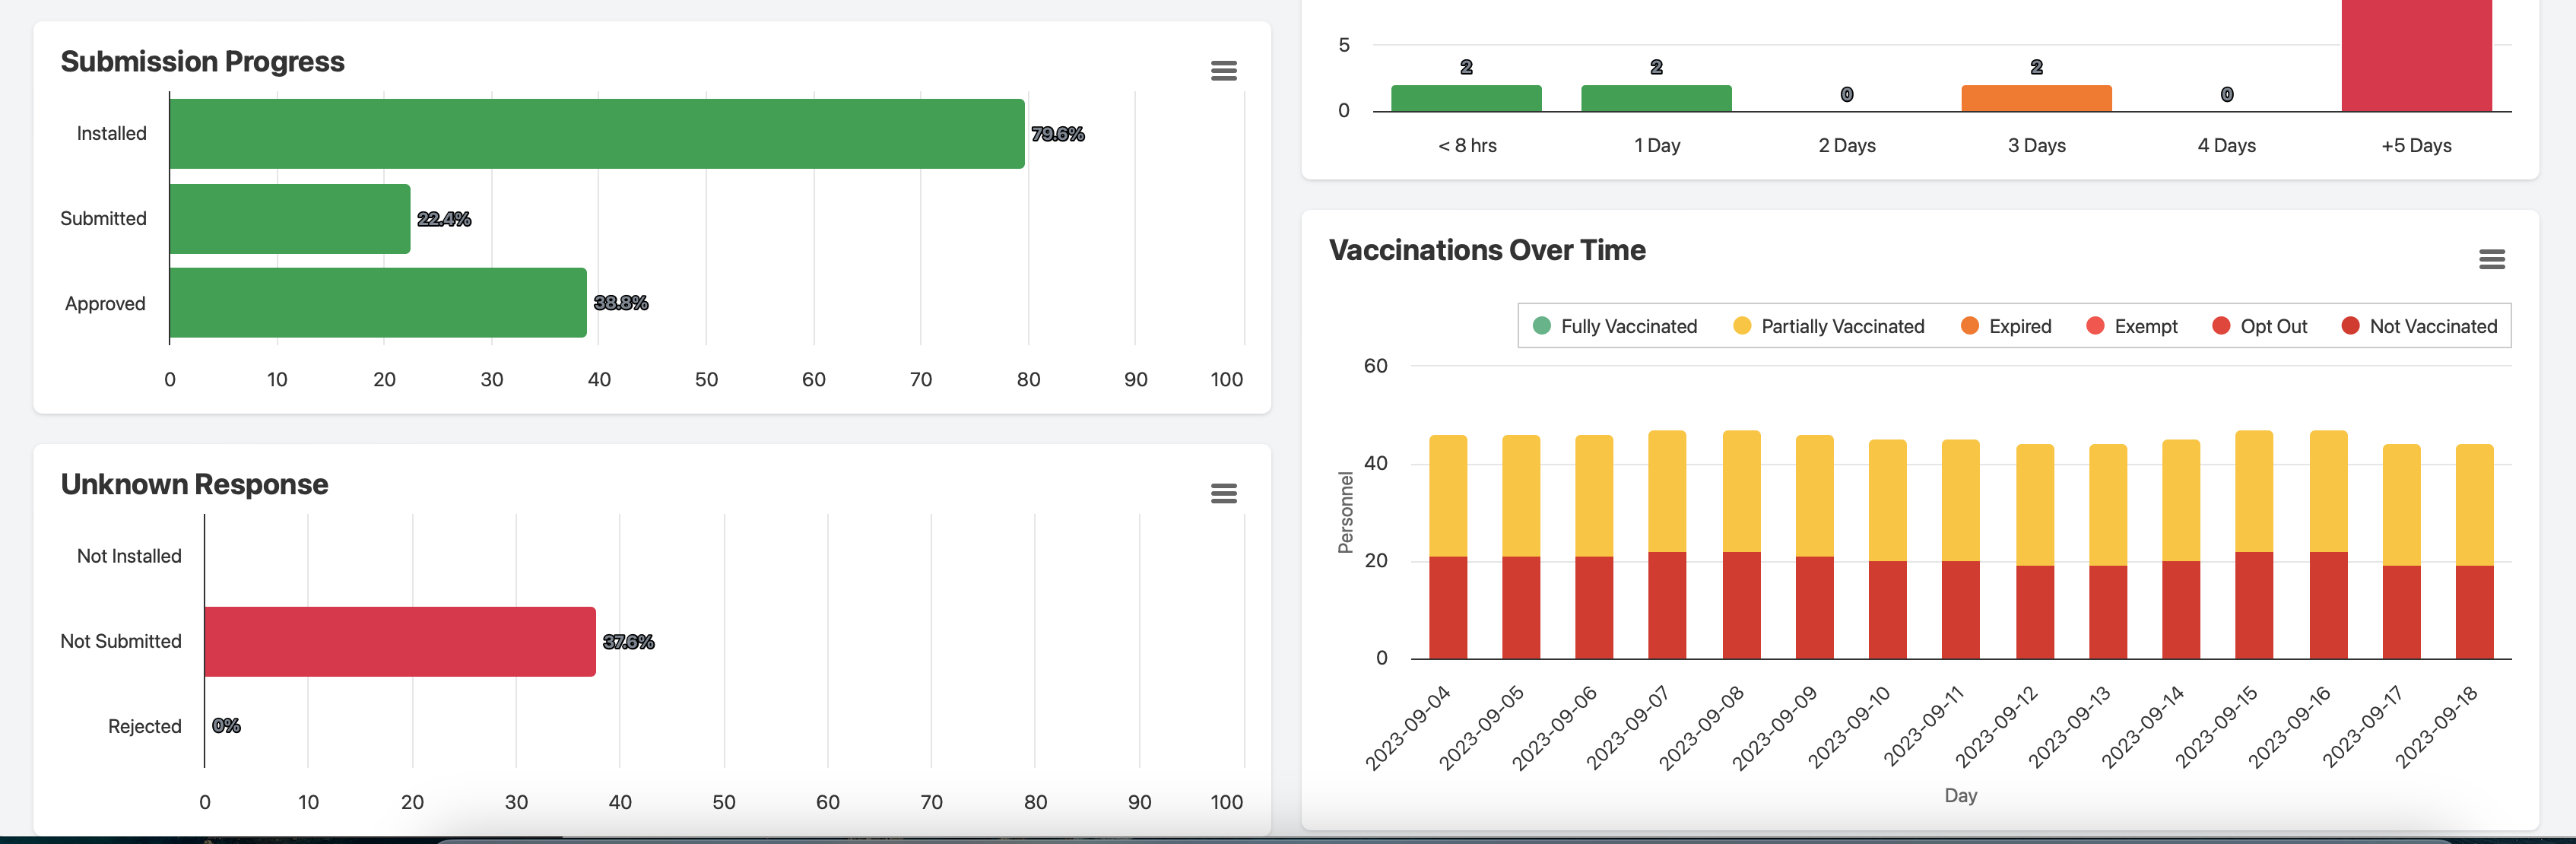
Workforce Locality Dashboard
The Workforce Locality page shows how many of your employee users are working in-person, remotely, or doing hybrid work. This data can also be filtered based on the location the users are set to, which will show how many of each type of locality is in that location, as well as a group.
Navigate to Workforce > Locality to access this dashboard.

Workforce Availability Dashboard
The Workforce Availability page shows how many of your employees are working, whether that be in-person, hybrid, or remote. This can be filtered by location and/or group.
Navigate to Threats> Availability to access this Dashboard.
